WAFERMAP
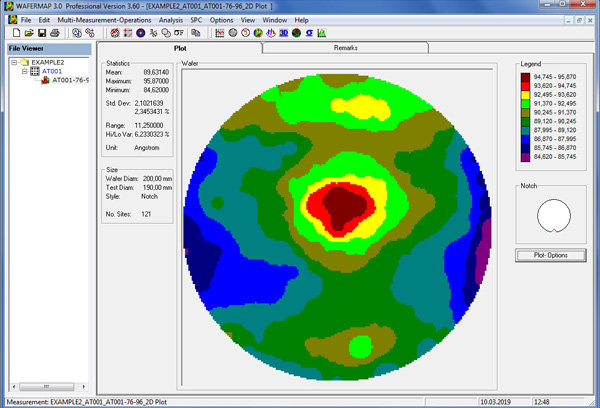
2D Plot
The color scale on the right side of the plot shows the range of values for each color. The ranges are defined depending on the maximum and minimum values for the specific wafer. The plot resolution, the marking of sites and the background color for this specific plot can be defined and changed by using the "Plot Options" button.

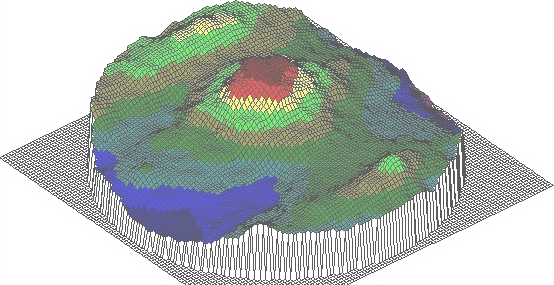
3D Plot
For the 3D plot, the user can specify the resolution in the x and y directions independently. The unit for these entries is mm. In addition, the user can define the scaling of the z direction of the plot, which represents the height of the values. The user can apply a specific angle, which defines the rotation of the wafer in the plot. Also, the user can change the rotation and the inclination of the plot grid.
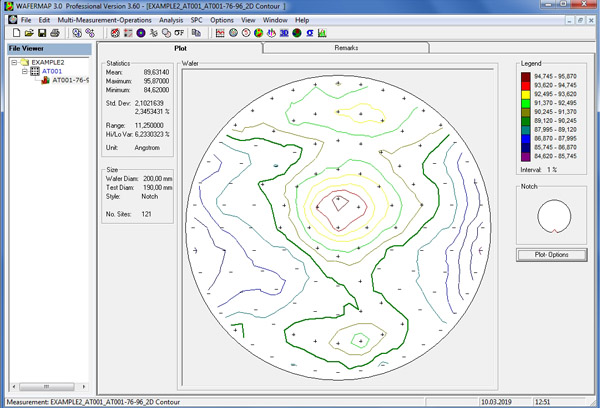
2D Contour Plot
A 2D contour plot shows lines of equal values. The distance between the lines is determined by a user defined interval which usually is specified as a percent of the mean value. The plot resolution, the interval, and the foreground and background colors for this specific plot can be defined and changed by using the "Plot Options" button.

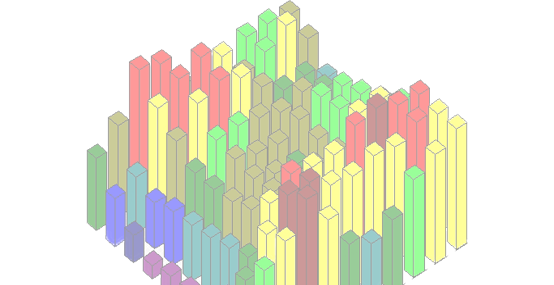
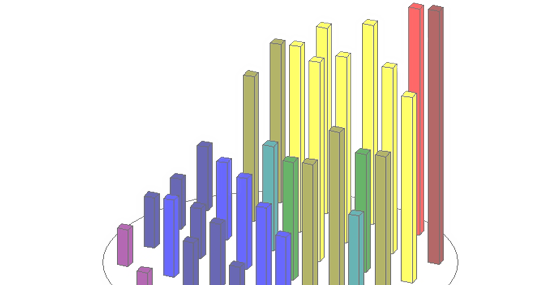
3D Bar Plot
This plot displays the measured values on the wafer as bars. The user can specify the width and depth of the bars independently. The unit for these entries is mm. In addition, the user can define the scaling in the Z direction, which represents the height of the values. The user can also change the rotation and the inclination of the wafer in the plot.

Line Scan
This plot displays a cut through the measured values on the wafer. The user can specify the line direction using either 1 point and an angle (dynamically changeable) or 2 points.
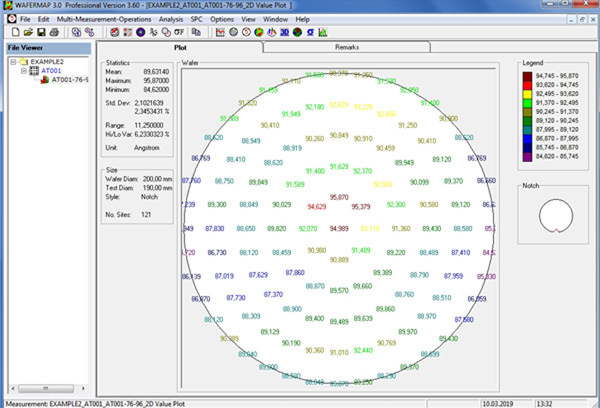
2D Value Plot
This plot displays all measured values on the wafer using color coding. The user can specify the colors.

SPC Browser
WAFERMAP includes a Browser in the SPC tool. This Browser allows the user to quickly preview multiple data sets. In addition, it is useful for comparison and drift analysis of production tools. All files that are loaded into the SPC tool will be displayed as thumbnail 2D color maps sorted by their file name. The file name will be shown above the thumbnails.
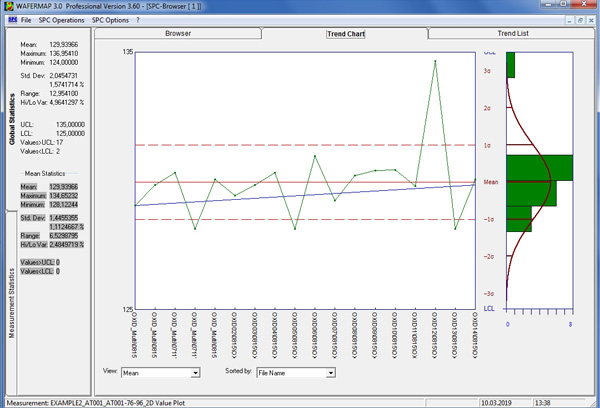
SPC Trend Chart
WAFERMAP includes a Trend Chart in the SPC Tool. This Trend Chart allows for statistical analysis of multiple data sets. In addition, it is useful for comparison and drift analysis of production tools. All files that are loaded into the SPC tool will be displayed. The user can define the displayed criterion in the selection area below the chart. The selections include the numerical values mean, maximum, minimum, standard deviation, range, high-low variation, and number of sites. Additionally, WAFERMAP allows for the selection of the measurement value at one of 5 predefined points on the wafer. These points may be actual measurement sites, or they can be an interpolated location. This WAFERMAP option allows for the comparison of the same site for all loaded wafers (e.g. the site in the center of the wafer).
The user can also choose the sorting criterion. This criterion can be a numerical value or some of the non-numerical values (e.g. the "Fab name" or the "Equipment info" from the wafer remarks). One use of this technique is to sort the data by tool characteristics.
The upper and lower control limits (UCL, LCL), and the sigma ranges (±1, ±2, ±3 sigma) are shown as horizontal lines on the plot if they are located within the plotted range.
On the right side of the plot area, the statistical analysis of the displayed value (Special Measure Statistics) is given in the form of a histogram. If for example, the displayed criterion is the mean, the histogram will show the distribution of the mean values of all selected wafers.
Single clicking on any marker of a displayed wafer brings up the Single Wafer Statistics for this wafer on the left side of the screen.